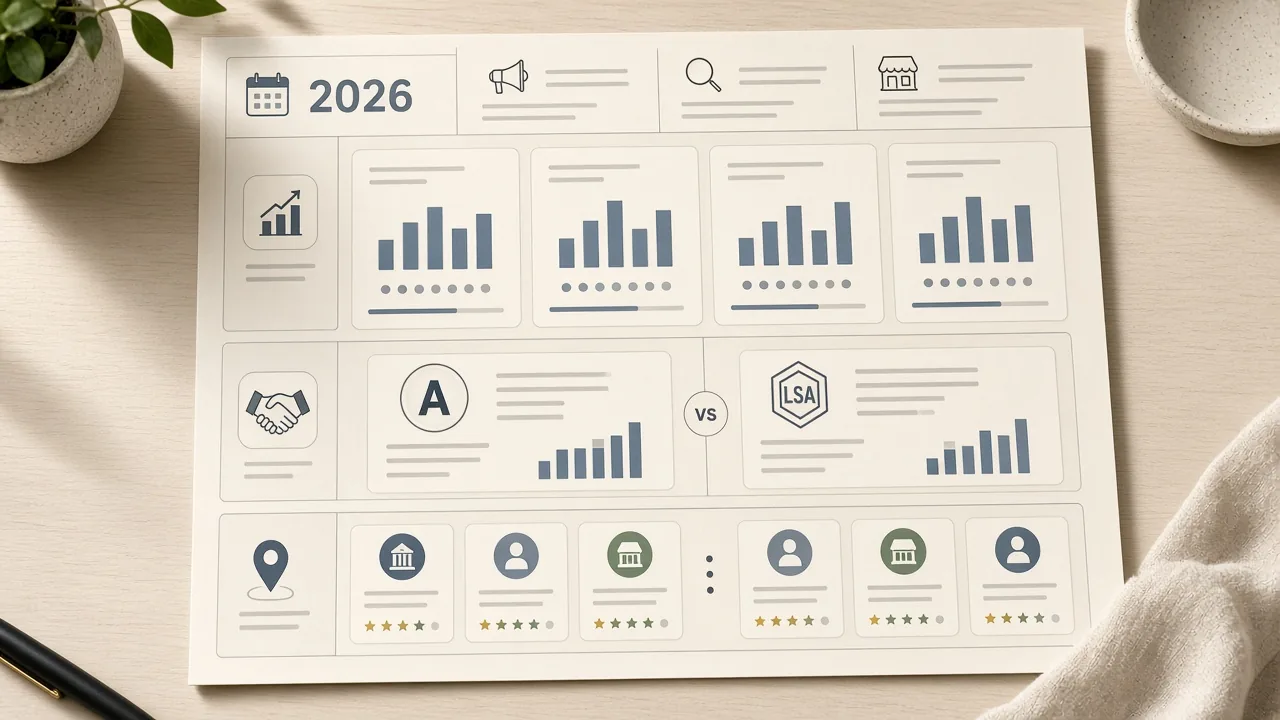
Cabinet marketing decisions still run on gut-feel numbers — this 2026 benchmark page consolidates sourced CPL, CAC, and local-search weights cabinet and kitchen businesses actually see. Home-services Google Ads median CPL sits near $90.92 across 3,211 campaigns (LocaliQ 2025); named managed-account proof for Bienal Custom Closets is $47 CPL from $234. Angi-class CAC still prints about $542 versus roughly $233 for Google LSA in the cited contractor set, and GBP signals still carry about 32% of Local Pack weight (Whitespark 2026).
You read the benchmarks. The homeowner is the audience. That one sentence keeps this research spoke out of coupon-gallery SERPs and inside commercial demand for shops that need showroom appointments and remodel consultations. Industry fit starts with the hub that matches your floor: marketing for kitchen & bath showrooms, marketing for cabinet dealers, marketing for kitchen and bath remodelers, or marketing for cabinet makers. The National Kitchen & Bath Association frames kitchen and bath as a design-led trade with long research cycles — budgets that ignore that cycle usually buy the wrong intent. Channel execution after fit lands on SEO for cabinet businesses and Google Ads for cabinet businesses. Dual path in: free cabinet audit and strategy booking. Named proof stays on the allow-list cases — Bienal Custom Closets, Cabinet Era, NextDAY Cabinets, and GBC Kitchen and Bath — with brief-approved numbers only.
Two data classes appear here: named CabinetBoost managed-account results and working spend bands from active cabinet campaigns, plus third-party benchmarks from published research verified with on-page attribution (LocaliQ, WordStream, PipelineOn, Whitespark, Invoca, IBISWorld, PayScale). Every figure below is sourced. Methodology and rejected figures sit later on this page.
CabinetBoost Case Study: From $234 to $47 CPL
Before managed Google Ads for Bienal Custom Closets, the business paid $234 per lead on a mix of shared and purchased sources — after a cabinet-keyword rebuild, CPL fell to $47 (an 80% drop) on the same budget class, below the $90.92 home-services median.
Lead quality was inconsistent at the $234 mark; the cost reflected market-rate shared-lead pricing, not a performance-optimized campaign (CabinetBoost case study, Bienal Closets, 2025). The rebuild centered cabinet-specific keywords, negative lists that cut non-buyer clicks, and landing pages aligned to closet and cabinetry intent. For context: LocaliQ’s home-services median CPL is $90.92 (n=3,211). Bienal’s $47 result sits near half that median and well under the Construction and Contractors subcategory median of $165.67. See the live Bienal Closets case study.
Google Ads CPL for Home Services (LocaliQ 2025)
LocaliQ tracked 3,211 US home-services Google Ads campaigns from April 2024 through March 2025 — median CPL $90.92, median CPC $7.85, median click-to-lead conversion 7.33% — and Construction and Contractors printed a higher $165.67 median CPL.
Range across tracked trades ran from Pools and Spas at $45.15 (lowest) to Roofing and Gutters at $228.15 (highest). CPL inflation adds pressure: 69% of home-services businesses saw CPL rise year-over-year, averaging a 10.51% increase — more than double the all-industry search CPL inflation rate of 5.13%. Cabinet shops with unoptimized campaigns are often already above the category median. (Source: LocaliQ Home Services Search Advertising Benchmarks 2025, n=3,211 campaigns.)
Facebook Ads CPL for Home Improvement (WordStream 2025)
WordStream’s 2025 Facebook Ads benchmark set puts Home and Home Improvement median CPL near $41.26 — with 1.94% CTR, $2.23 CPC, and 5.22% click-to-lead conversion — cheaper per lead than Google contractor CPL, at a different intent stage.
That is roughly four times cheaper per lead than the Google Ads contractor CPL of $165.67, but Facebook leads are awareness-stage prospects who responded to a visual ad; Google search leads are active-query prospects seeking a local cabinet shop today. The most effective cabinet stacks combine both: Meta for reach and remarketing audiences, Google for high-intent conversion. (Source: WordStream Facebook Ads Benchmarks 2025.)
Customer Acquisition Cost by Channel (PipelineOn 2026)
PipelineOn aggregated 888 contractor campaigns — Angi printed about $542 CAC, Google Local Services Ads about $233 CAC on a $53 average CPL with a 43.9% booking rate — and mature organic SEO landed roughly $50–$150 CAC in the same contrast set.
Referrals delivered under $50 CAC but do not scale without a systematic ask in the sales process. The Angi vs LSA gap is the clearest paid-lead contrast in the dataset: both are pay-per-lead models, but LSA leads book and close at materially higher rates in that sample. (Sources: PipelineOn Contractor CAC by Channel 2026; PipelineOn Home Service Marketing Benchmarks 2026.) Remodelers comparing rented vs owned demand should score owned appointments, not shared CSV length.
Local SEO Ranking Factors for Cabinet Shops (Whitespark 2026)
Whitespark’s 2026 Local Search Ranking Factors survey (~50 expert panelists) weights Google Business Profile signals at about 32% of Local Pack ranking — the single largest factor block — with reviews near 20% and on-page signals near 15%.
For cabinet shops, that hierarchy is actionable: GBP primary category, photo frequency, Q&A, and post cadence deliver the highest leverage per hour for local visibility. A shop with a built-out GBP and steady review velocity consistently outperforms competitors that rely on ad spend alone. (Source: Whitespark Local Search Ranking Factors 2026.)
AI Overview Prevalence on Local Cabinet Searches (Whitespark 2025)
Whitespark’s May 2025 local case study found AI Overviews on 57–80% of tested local-intent queries — while classic local packs averaged about 39% on the same searches — so AI Overviews now appear more often than map packs on many local SERPs.
Pages cited by AI systems receive measurably more traffic than pages the systems ignore. AI systems preferentially cite sources with named statistics, dated sources, and consistent attribution. For a cabinet shop or marketing partner to appear in an AI Overview on cabinet marketing costs, the page must function as a credible, named data source — which is the job of this benchmark spoke. (Source: Whitespark, AI Overviews in Local Search, Miriam Ellis, May 2025.)
Marketing Investment Benchmarks by Revenue Tier (CabinetBoost 2026)
Working monthly investment bands from 7+ years of managed cabinet and kitchen campaigns — verified by Sezgin Arslan, Founder, 2026 — put ~$500K shops near $2,500–$5,000/month, ~$1M shops near $4,000–$8,000, and ~$2M shops near $8,000–$16,000.
These are spend bands at which measurable, trackable lead volume has been generated for shops at each tier — working monthly investment ranges, not a portfolio-wide performance multiple. Market competition, density, and service type move you inside each range: a high-competition metro warrants the upper end; a quieter market can start lower. (Source: CabinetBoost internal campaign benchmarks, 2026.)
Phone Call Conversion Rates in Home Services (Invoca 2025)
Invoca’s 2025 Call Conversion Industry Benchmarks Report finds 46% of home-services phone calls convert to leads — 37% convert during the call itself, and 61% of callers speak with a person — so missed calls quietly inflate every channel’s real CPL.
If a campaign generates 100 inbound calls and 20% go unanswered, effective CPL rises about 25% — independent of bid strategy or keyword quality. Treat answer rate as media math. (Source: Invoca Call Conversion Industry Benchmarks Report 2025.)
Cabinet Industry Market Size and Wage Data
IBISWorld’s 2025 Cabinet Makers report counts 4,281 custom cabinet-maker businesses in the United States — roughly $2.7B revenue and a −0.6% CAGR from 2020–2025 — while PayScale puts average employee wage near $21.12/hour.
Most shops are owner-operated — the segment most likely to purchase done-for-you marketing rather than hiring in-house digital staff. Loaded employer cost typically runs 1.4–2× base wage; use about $29–$42/hour for shop cost modeling. (Sources: IBISWorld Cabinet Makers 2025; PayScale Cabinet Maker Salary 2025.)
Methodology
Proprietary figures (named Bienal Closets CPL and CabinetBoost working spend bands) come from direct access to managed campaign accounts — no third-party survey interpolation — and third-party figures appear only when the cited number was confirmed on-page.
Attributed to the specific client relationship or marked as aggregate working benchmarks from the CabinetBoost portfolio. Verified by Sezgin Arslan, Founder, CabinetBoost. Rejected examples (not used here): PipelineOn “SEO delivers 500%+ ROI vs PPC 200%” with no underlying study named; MDMPPC 2025 CPA $9.01 (n=20, blended networks); “46% of all Google searches have local intent” with no living primary source. Measurement period: CabinetBoost proprietary data reflects active campaigns through 2025–2026; third-party data follows each source’s own collection window noted above.
Quick-Reference: All 2026 Benchmarks
| Metric | Value | Source | Year |
|---|---|---|---|
| CPL — Bienal Closets before | $234 | CabinetBoost / Bienal Closets | 2025 |
| CPL — Bienal Closets after | $47 | CabinetBoost / Bienal Closets | 2025 |
| Budget — ~$500K revenue shop | $2,500–$5,000/mo | CabinetBoost benchmarks | 2026 |
| Budget — ~$1M revenue shop | $4,000–$8,000/mo | CabinetBoost benchmarks | 2026 |
| Budget — ~$2M revenue shop | $8,000–$16,000/mo | CabinetBoost benchmarks | 2026 |
| Median CPL — home services Google Ads | $90.92 | LocaliQ (n=3,211) | 2025 |
| Median CPL — Construction & Contractors | $165.67 | LocaliQ | 2025 |
| Median CPC — home services Google Ads | $7.85 | LocaliQ (n=3,211) | 2025 |
| CPL inflation — home services YoY | +10.51% | LocaliQ | 2025 |
| Median CPL — Facebook Home Improvement | $41.26 | WordStream | 2025 |
| CAC via Angi | $542 | PipelineOn (n=888) | 2026 |
| CAC via Google LSA | $233 | PipelineOn | 2026 |
| CPL via Google LSA | $53 | PipelineOn | 2026 |
| GBP signals weight — Local Pack | 32% | Whitespark LSRF 2026 | 2026 |
| Review signals weight — Local Pack | 20% | Whitespark LSRF 2026 | 2026 |
| AI Overview prevalence on local queries | 57–80% | Whitespark (Miriam Ellis) | 2025 |
| Classic local pack prevalence | 39% | Whitespark (Miriam Ellis) | 2025 |
| Phone call conversion — home services | 46% | Invoca | 2025 |
| Average cabinet maker wage | $21.12/hr | PayScale | 2025 |
| Custom cabinet maker businesses in US | 4,281 | IBISWorld | 2025 |
How CabinetBoost Uses These Benchmarks
The Bienal Closets move from $234 to $47 CPL is what a campaign looks like when category median CPL, negative lists, and cabinet landing pages are known before spend scales — and the next step is matching those sourced bands to your floor through the fitting industry hub.
These benchmarks give any cabinet shop three things: a realistic expectation for paid marketing cost in this vertical, a reference point for whether a current CPL is normal or structurally broken, and context for why channels deliver different quality at different prices. If current Google Ads CPL sits above $150 or Facebook CPL above $60, there is usually a structural issue — match type, negatives, or landing page — that a cabinet-specific audit will surface.
Named allow-list color stays brief-tight: Cabinet Era 3 → 6 locations, NextDAY Cabinets #1 rankings, and GBC Kitchen and Bath’s founder-attributed $100k burned across 3 agencies when a pitch reports activity instead of sits — see Cabinet Era and GBC Kitchen.
When you’re ready to hire, match the hub to your floor: marketing for kitchen & bath showrooms and marketing for cabinet dealers book 20 showroom appointments in 90 days or you don’t pay; marketing for kitchen and bath remodelers books 20 remodel consultations in 90 days or you don’t pay; makers start from marketing for cabinet makers. Channel execution still routes to SEO for cabinet businesses and Google Ads for cabinet businesses after fit is clear. Founder Sezgin Arslan has 7+ years in cabinet-industry marketing. Take the free cabinet audit or book a strategy session to map these bands to your market.
Get a free cabinet audit → · Book a strategy session →
Data Update Cadence
Last research refresh for this retrofit: 2026-09-05 — CabinetBoost proprietary bands are reviewed quarterly, and third-party figures update when LocaliQ, WordStream, or Whitespark publish new editions.
When citing any figure from this page, note the measurement year — marketing costs shift materially year-over-year (+10.51% home-services CPL YoY, LocaliQ 2025). This spoke stays apex noslash at /cabinet-marketing-benchmarks-2026.